There's a popular meme that gets floated around a lot, especially on finance, economics, or politically oriented social media:
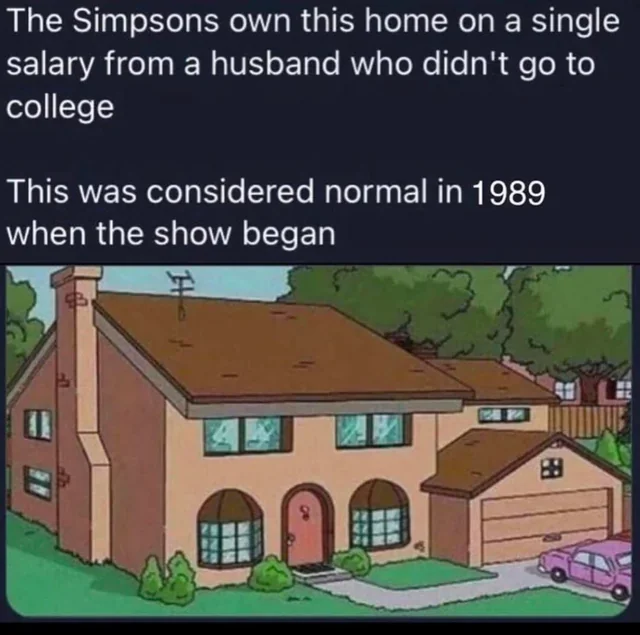
This is one of those amazing forms of humor the Internet produces, where the punchline is the people who take it seriously. It's trolling of the highest caliber. A 1-question litmus test for Dunning-Kruger among the economically opinionated.
A lot of people consider popular media a kind of cultural artifact: fictional, but still grounded enough in contemporary life to be relatable. Thus, the thinking goes, even though the Simpsons themselves are imaginary, the universe in which they were originally conceived is a reflection of the Zeitgeist as it existed at the time of conception. A slice of Americana frozen in time, depicting a world that was slowly stolen from us by, like, capitalism. Or something.

I don't want to sound pretentious here, but The Simpsons is a dramaturgical skewer. It reflects culture through exaggeration and absurdity -- distortions of reality -- and the line between reality and fantasy is drawn wherever the writers need it to be to tell a joke or move a story along. The writers themselves repeatedly made this point in Homer’s Enemy.
That said, what makes this particular meme so viral is that it exploits a widely held intuition: a lifestyle that seemed plausibly middle-class in the 1980s feels unattainable today. That's actually a fairly important point, and one to which Simpsons lore is entirely inconsequential because empirical evidence already exists.
Careful, That’s a Load-Bearing Post🔗
First, as a massive nerd who predates the Simpsons and watched all of these early episodes on their original air dates, I happen to be something of an expert on the subject of early Simpsons canon. And I simply can not have this conversation without correcting a core premise of the meme.

I'll let the nerds of Springfield explain:

"How the Simpsons came to own their house is actually explained in Lisa’s First Word, which canonized the Simpson home being purchased in 1984. This episode aired in 1992 during the final season where most of the writing team that launched the show were still on staff. Meaning that this story is as canonical to Simpsons lore as anything."
"The same episode clearly established that Homer and Marge couldn't afford the house on Homer's income. It was only made possible when Grandpa Simpson sold his house to provide Homer with $15K for their down payment. Also keeping in mind that $15,000, circa 1984, would be closer to $45,0001 in 2024."


"In When Flanders Failed, which aired in 1991, Flanders comments 'Homer, affordable tract housing made us neighbors, but you made us friends.' So we know that the Simpsons live in a cheap tract home. $15,000 towards a tract home in 1984, in a town the size of Springfield, would cover at least 20% of the price, if not more."
In any case, if we're going to infer anything at all about housing in 2024 based on things we saw on The Simpsons in 1992, we need to modify the original premise and assert: "home ownership on a single income seemed plausible when a couple received 20% or more towards a cheap suburban house in a small town in 1984." Which honestly, seems about as true today.
Living In The BLURST of Times🔗
Usually in a thread where you see this meme, someone will share an argument and data set that looks something like this:
- In 1984, the median home price (averaging the year's four quarterly readings) was $79,9502, and the median household income was $22,420/yr3. Adjusting for inflation1, these numbers are $241,380 and $67,689/yr, respectively.
- In 2024, the median home price (again, averaging the year's four quarterly readings) is $418,9752, and the median household income is $83,730/yr3.
- Thus, inflation-adjusted home prices have increased 73.5%, but household incomes have only increased 23.6%.
- Holy shit, inflation-adjusted home prices have increased at more than 3x the rate of household incomes!
The conclusion being that homes are less affordable today because for every 1% household incomes increased, home prices increased about 3.11%. It's all very plausible, until you realize that basically no one ever buys a house outright.
People typically borrow money from a bank to buy a house, and they pay the bank back in installments. This is called a mortgage. A mortgage payment is the sum of a few things:
- Paying back some of what you owe ("principal")
- Paying rent on the money you haven't paid back yet ("interest")
- Taxes and insurance (these are highly specific to a region)
For the rest of this post, let's focus simply on the principal and interest (P+I) payment you'd owe to the bank, and set aside things like property taxes, PMI and homeowners insurance.
Cheap Money vs Expensive Money🔗
When interest rates are low, it's cheap to borrow money. When they're high, it's expensive. So if you're going to compare housing costs between 1984 and 2024, you can't do so without also looking at mortgage rates. This is what real-life people were dealing with in 1984 compared to 20244:
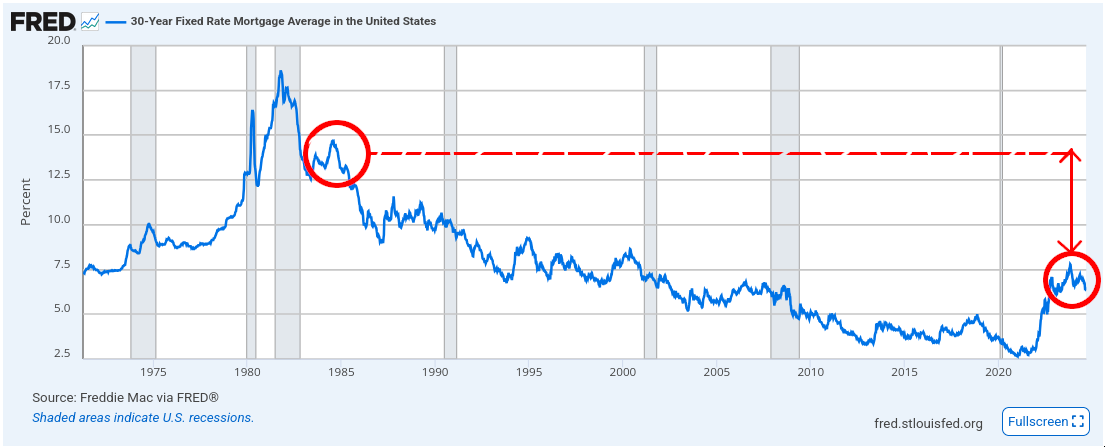
Back in 1984, the average 30 year fixed rate mortgage was like 13.9%4. In 2024, the same rate is about 6.7%. Less than half. So while homes may have cost 42% less on an inflation-adjusted basis, the prevailing mortgage rate was 107% higher.
We immediately run into another apples-to-oranges problem with the down payment. You could measure it in hours worked at minimum wage, which people love to do, except that the percentage of workers actually earning minimum wage dropped from ~11% in 1984 to less than 1% by 20245. You can't make general assertions about the economy based on cashflows at the extremes.
The right way to handle this is to hold the actual household sacrifice constant and assume two median households with an identical savings rate (say, 5% of their income for two years) towards a down-payment on a median home. Same-sized slice of the household budget, same amount of time.
With this in mind, we can make a roughly apples-to-apples comparison of the home-buying realities for the median households of 1984 and 2024.
| 1984 Median Household* | 2024 Median Household | |
|---|---|---|
| $67,689 | Annual Household Income | $83,730 |
| $6,800 | Save 5% for 2 years for Down-Payment‡ | $8,400 |
| $241,380 | Median Home Price | $418,975 |
| $234,580 | Amount Borrowed | $410,575 |
| 13.9% | Typical 30y Fixed Interest Rate | 6.7% |
| $2,760.92/mo | P+I Owed to Bank | $2,649.35/mo |
* inflation-adjusted to 2024
‡ This isn't meant to represent the typical historical down payment, just a normalization. We assume an equal savings rate over equal time, so neither household gets an arbitrary advantage before we compare financing costs.
Wait... what? That's right, even with 2024 interest rates in the high 6's, a median household buying a median house will have a lower P+I payment in 2024 than in 1984 when inflation is taken into account. Not by much, but by ~$112/mo in 2024 money.
In fact, when we zoom out and do this comparison across time, a clear pattern emerges. Below is the ratio of P+I on the median home to median household income, for the years 1984-2024. No inflation adjustment is needed because the numerator and denominator are from the same year:
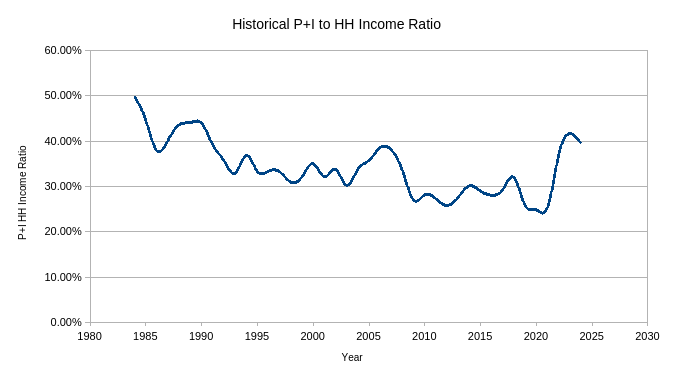
This chart is not a full homeownership-cost index (more on that in a minute). It’s simply a financing-burden view of affordability. Taxes, insurance, and maintenance all factor in as well, but to be fair, the meme isn't complaining about property taxes.
But look closely: in 1984, the median household would be paying around 50% of the annual household income towards P+I on their median house. By 2024, that ratio was closer to 40%.
A Perfectly Cromulent Result🔗
Again, the previous comparison wasn't contrived to result in any particular conclusion. But if the conclusion feels alien or unexpected, that's okay because the numbers also happen to align with something even more concrete: the National Association of Realtors Housing Affordability Index (HAI)6. The HAI attempts to answer the question:
Can a family earning the median family income afford the mortgage on the median-priced existing single-family home, at prevailing mortgage rates?
Which is basically what the meme is talking about. The HAI has been published annually since 1970, so we can easily compare the affordability of homes across years or decades. In 1984, the year the Simpsons supposedly bought their house, the HAI had an affordability index of 84.67.
In other words, the median American family could not qualify for the median American house in 1984 under NAR's own affordability standard.
In contrast, throughout 2024 the HAI has averaged 97.38 (through Q1 it averaged 102.2). So meaningfully better than the situation that existed when the Simpsons would have bought their house. Just like the previous examples found.
"But wait! The HAI mostly answers the mortgage qualification question! It doesn't fully answer the question of what owning a home actually costs."

Okay, so mortgage qualification isn't mortgage affordability. That's why the Atlanta Fed has something called the Home Ownership Affordability Monitor (HOAM). This measure looks specifically at how affordable home ownership is; with this measure, anything under 100 is considered unaffordable.
It tells broadly the same story: within the period HOAM covers, current conditions suck, but they aren't unprecedented. Take a look9:
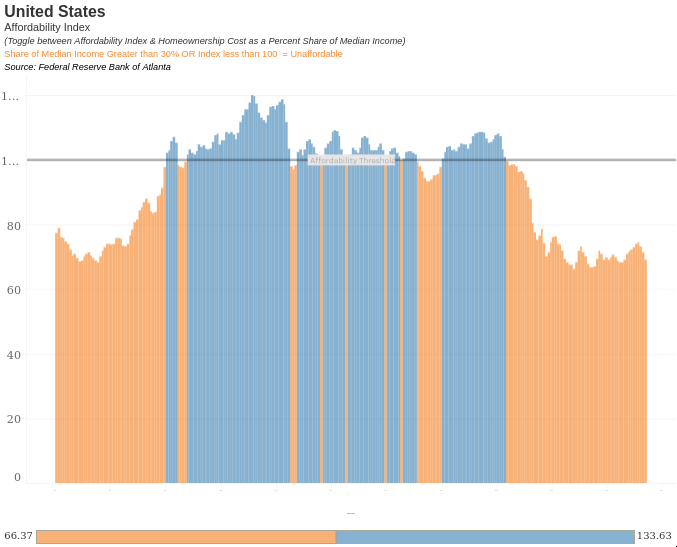
Unfortunately, the measure doesn't precede January 2005. But we can see 2024 is about on par with 2005 for affordability. The home ownership story in 2024 isn't new as much as history echoing.
It's also really important to keep in mind that the economics of home ownership aren't experienced uniformly across a generation either. People who bought in 1972 at 7% interest were still living in those houses in 1981 while new buyers were staring down 18%+ mortgages.4

The millennials and Gen-Z people who bought a house at 2.7% in 2021 are living comfortably in homes those same people wouldn't be able to afford if they'd waited just 3 years. Their cohort who put off buying got hit with high prices and high interest rates. Worst. Timing. Ever.
That's Unpossible!🔗
Another really important thing to keep in mind regarding housing circa 1984 and housing in 2024 is what's called a "composition effect": over the past several decades, new homes have been gaining substantially in size and amenities.
To put it in perspective, the 1985 American Housing Survey found the median owner-occupied detached single-family home was about 1,712 ft²10. For households containing five people (like the Simpsons), the median was about 1,945 ft²10.
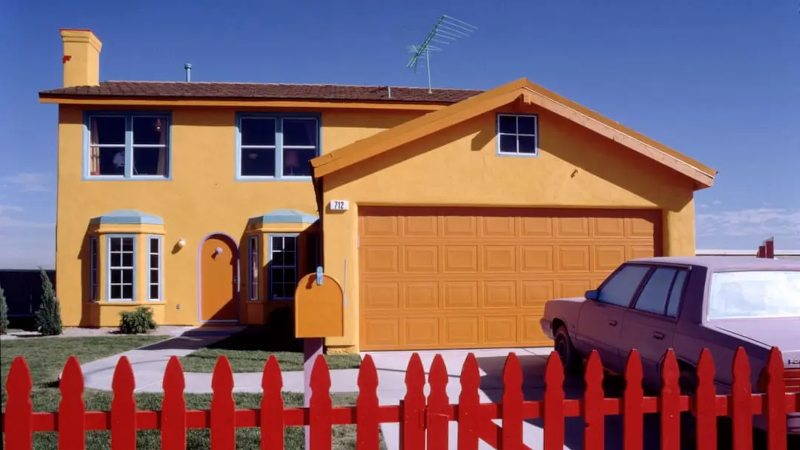
Meanwhile, when Fox built a 1:1 replica of the Simpsons home in Henderson, NV, it came in at 2,180 ft²11, about 27% larger than the typical 1984 owner-occupied detached home, and ~12% larger than the typical home occupied by five people in 1984.
New home builds have been gradually increasing in size since at least the 1950s, and the Simpsons' house is still larger than the median size of a newly completed single-family home in 2024 (2,146 ft²12). So even in 1989–1992, the Simpsons' house was substantially larger than the typical owner-occupied home. It wouldn't look average-sized until the mid-2020s.
The Simpsons House Fallacy🔗
Let's first concede the obvious points:
- Homes are unequivocally more expensive in 2024 than they were in 1984, even when accounting for inflation.
- Between 1984 and 2024, home prices became more expensive faster than incomes rose.
Those are the nuggets of truth that the meme plays off. And yet, the conclusion that homes are less affordable today is, paradoxically, incorrect.
Data on the accessibility of home ownership not only exists, but has been closely tracked by economists and the government for decades. We don't need to rely on sitcoms of the 80s and 90s to inform the debate. We just need to know enough about economics to look it up.
That data doesn't support the assertion that home ownership was somehow dramatically more affordable in the 1980s. Once you account for income, financing costs, and the changing housing stock, the comparison gets a lot messier, and NAR's long-running affordability index actually puts 1984 in worse shape than 2024.
That's how we also get these gems, clowning on people who take the Simpsons meme seriously:
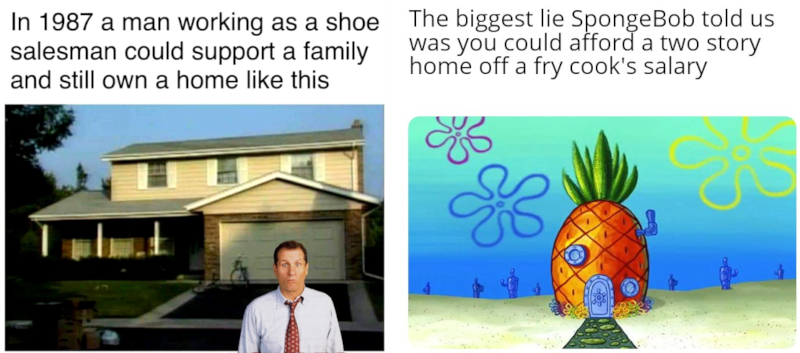
"$80,000 house then, $420,000 house now" fits comfortably into a JPEG, and it feels about right, but it's a fallacy to conflate home price with affordability. Affordability is a product of price, income, financing costs, taxes/insurance, and (arguably) the characteristics of the thing being purchased.
Reality has always had terrible meme discipline.
Sources🔗
- https://www.usinflationcalculator.com/
- https://fred.stlouisfed.org/series/MSPUS
- https://fred.stlouisfed.org/series/MEHOINUSA646N
- https://fred.stlouisfed.org/series/mortgage30us
- https://usafacts.org/articles/minimum-wage-america-how-many-people-are-earning-725-hour/
- https://www.nar.realtor/research-and-statistics/housing-statistics/housing-affordability-index/methodology
- https://www.huduser.gov/periodicals/ushmc/summer2001/histdat11.htm
- https://www.nar.realtor/sites/default/files/2024-10/hai-08-2024-housing-affordability-index-2024-10-11.pdf
- https://www.atlantafed.org/research-and-data/data/home-ownership-affordability-monitor
- https://www2.census.gov/prod2/ahsscan/h150-85.pdf
- https://www.zillow.com/homedetails/712-Red-Bark-Ln-Henderson-NV-89011/7074991_zpid/
- https://www.census.gov/construction/chars/xls/squarefeet_cust.xls