For the past 6 years at Websolr (One More Cloud), I've advised dozens (maybe hundreds) of customers how to improve their Solr performance. 90% of the time, the customer is using a tool like NewRelic to benchmark their queries. When they see hundreds of ms per request, they reach out to ask why Solr is so slow.
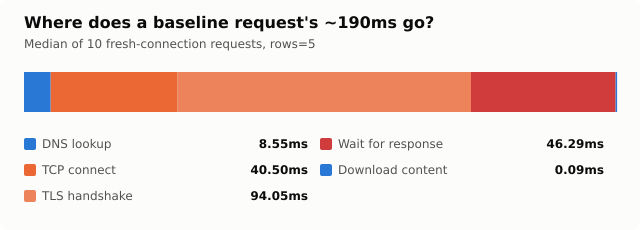
The thing is, Solr is a battle-tested beast of a search engine, and is blazing fast. What NewRelic is actually measuring here, more than Solr, is the network transit time. It’s not uncommon for a round-trip, over-the-wire request to spend most of its time not actually doing anything in Solr:
My standard advice was always just an affirmation of a triad of boring old best practices: "use HTTP keep-alive, compress over the wire, and load balance your reads and writes."
But, embarrassingly, I've never actually benchmarked this advice. So when someone asked: "can you put some numbers to that so I can decide how much engineering resources to spend on it?" I was at a loss.
I worked out a benchmarking concept (see Appendix 2 if you want to know more), which tests how much wall clock time it takes to:
- Reindex 50K docs
- Perform 1K searches
- Perform 1K mixed (read/write) ops
Nothing But Nothingburgers🔗
Imagine if people communicated like an HTTP request: you want to have a conversation with a friend far away. So you look up their number, dial it, wait for them to answer, and then say: "Hey! How are you?" Your friend responds: "I'm good, how are you?" Then they hang up.
Then you look up their number again, dial it, wait for them to answer, and then say "I'm well, thanks. How's the family?" They say "everyone is good, my folks are moving to Florida." Then they hang up again. Repeat for an hour.
It would be so tedious to converse that way, with all the constant re-dialing and hanging up. Why not just dial once, have the complete conversation, then hang up? That's essentially connection reuse.
When you make an HTTP request to a remote machine -- especially over TLS -- there are a lot of handshakes and protocols involved, just to ask a question and get an answer. All of that set up is discarded once the server is all done responding.
One of the easiest ways to signal to a server that you wish to reuse an existing connection is HTTP keep-alive. Keep-Alive allows us to include a header in our initial request that tells the server not to hang up right away.
I set up my test application and ran the benchmark tests:
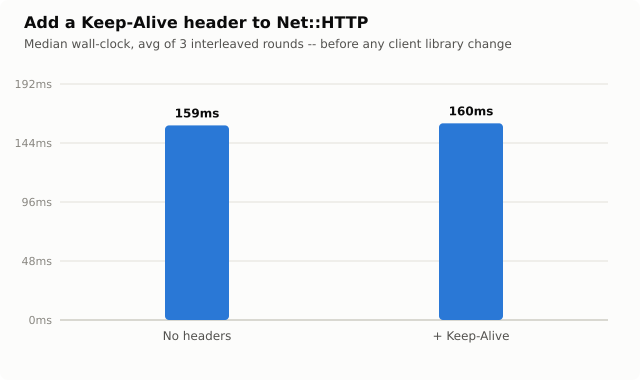
... aaand nothingburger 🍔.
Fine then, so let's move on to compression. Compression is cool because you usually save more time sending a compressed payload over the wire than you spend compressing and decompressing it at either end. Solr supports gzip compression out of the box, but with Sunspot we need to explicitly set a header, Accept-Encoding: gzip, and then manually decompress the response with Zlib::GzipReader.
I set that up and benchmarked again. In this test, I looked at the median and p95 times to see the effect at the long tail:
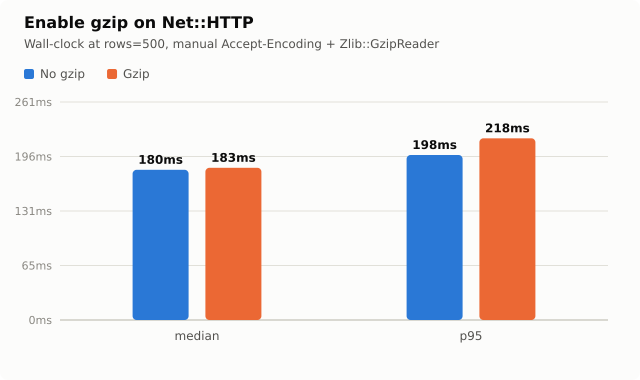
Compression doesn't seem to help either, and it might even hurt at the long tail.
The last thing I usually recommend is to use Websolr's routing header feature. These essentially let users direct requests to either their primary core or replica core. The idea being that when all traffic goes to the primary core, it's serving the double-duty of flushing out updates to disk and updating search contexts while also processing queries to that same data.
At scale this means you can have one core that is saturated with requests, leading to high latencies, while other cores sit idle. So sending writes to the primary core while sending queries to a replica core can balance the load and offer better performance (caveat: replication isn't instant, there's an average of ~30s between an update being pushed to the primary and being reflected in search results on the replica, so this is one of those recommendations that depends on the workload involved).
Even though it's not a general-purpose solution, I figured I've recommended it so long, I should probably test the impact. So I did:
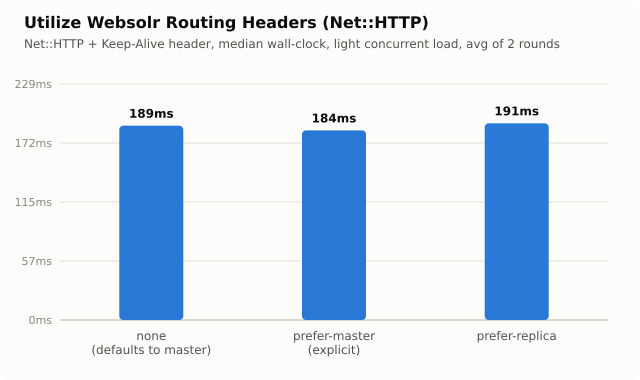
This was, uh... surprising turn of events! All of these suggestions should make things noticeably faster. But it's not really doing anything.

Time to Stop Guessing🔗
So keep-alive did nothing. Compression did nothing (maybe worse than nothing). Routing headers actively made things worse... somehow. The advice is definitely solid, so why isn't it working?
Before throwing it all out the window, we need to inspect the plumbing a bit. Make sure that the things we're doing at the surface aren't just being ignored or swallowed up at some other layer.
First I checked the embarrassing thing: was the Keep-Alive header even going out on the wire? Yup. Good, so why is it not being honored by Websolr? Let's dump some TCP:
tcpdump -i any -n 'tcp[tcpflags] & tcp-syn != 0 and tcp[tcpflags] & tcp-ack == 0 and port 443'I fired off 20 identical searches, reusing the exact same Faraday::Connection object every time -- the same memoized connection a real Sunspot session actually uses. If reuse were happening at all, I should've seen 1 TCP handshake and 19 requests riding on top of it.
Instead, I saw 20 SYN packets. That's 20 separate TCP connection attempts -- regardless of the header, regardless of reusing the same Ruby object. Which means Websolr isn't hanging up repeatedly, Sunspot is! This explains why none of my advice was working: I was accidentally trolling the server:

Me: "Hello, I want to have a conversation so don't hang up right away."
Server: "Okay!"
Me: hangs up
Me, again: "Hello, I want to have a conversation so don't hang up right away."
Server: "Okay!"
Me: hangs up
Me, again: "Hello, I want to have a conversation so don't hang up right away."
On a more serious note, there is a lesson to be learned here. Connection reuse is the strategy, while keep-alive is merely a component of the strategy. Those are not the same thing, and conflating them leads to situations like this, where you assume the strategy has been implemented because one component of it is in place.
This still doesn't answer the question of why connections aren't being reused, so we have to dig deeper. Sunspot talks to Solr through RSolr, which talks to Solr through Faraday. Faraday is an abstraction layer for the HTTP client. It lets us plug in more or less any number of supported HTTP clients without needing to know any implementation details about them.
Turns out the default backend is Net::HTTP, which ships with Ruby and drags in zero dependencies. It's a perfectly reasonable default to pick, which is exactly why nobody ever questions it. I went looking at Faraday's net_http adapter specifically, expecting to find some kind of connection cache, only to discover there isn't one.
That's right: Faraday's plain :net_http adapter builds and tears down a fresh Net::HTTP connection on every. Single. Call. By design. Now, to be fair, Faraday ships a separate adapter, net_http_persistent, specifically because the default one doesn't do this. You just have to know it's there and why it's necessary.
Anyway, we were quietly paying the connection costs, repeatedly. This actually explains why compression didn't have a noticeable impact either.
Recall the phase-breakdown chart at the top of this post: the TLS handshake alone eats roughly half of a typical request, with actual data transfer barely registering. Gzip only shrinks the transfer phase, which was already trivial to begin with. With connection resuse quietly being ignored, any reduction in transfer phase would have been dwarfed by the much more expensive connection phases. More on this in a moment.
Enter Typhoeus🔗
Fortunately the flexibility of Faraday let me pivot to a much better HTTP client: Typhoeus. It's a modern alternative that wraps libcurl and offers considerably more options.
Simply adding Typhoeus to your Gemfile will not be enough. Neither Sunspot nor RSolr will pick it up automatically, and Sunspot doesn’t let you specify Faraday adapters in the sunspot.yml configuration file. The workaround I used was to create a custom connection class that invoked RSolr::Client with a Faraday object that had the Typhoeus adapter. Then I ran another benchmark:
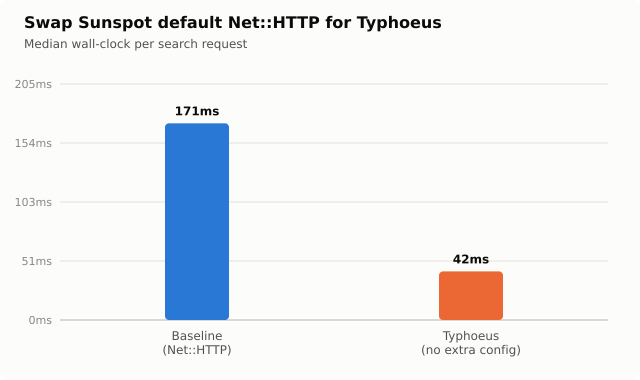
Swapping Net::HTTP for Typhoeus and nothing else offers a massive improvement! Median wall-clock latency dropped from 171ms to 42ms -- a 75% drop -- while median QTime sat at a flat, boring 0-1ms in both configurations. Solr spent the same sliver of a millisecond doing actual work before and after. Every one of those 129 milliseconds came from somewhere between my code and Solr's front door, not from Solr itself. With no other changes except for the HTTP client, we just deleted three quarters of the request time. This is the kind of improvement we're looking for!
But one question remains: can we make it faster?
Let's Try This Again🔗
With Typhoeus in place, I went ahead and reconfigured HTTP Keep-Alive, then re-benchmarked. The result remained significantly better than Net::HTTP, but not really an improvement over Typhoeus' defaults:
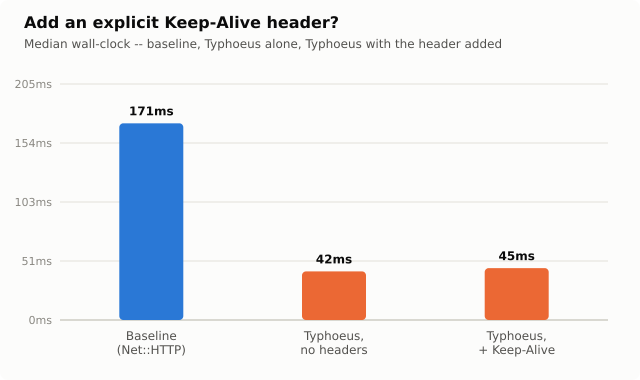
The only explanation here is that Typhoeus must be pooling connections on its own somehow, regardless of any headers I'm setting. I re-ran the tcpdump command, this time seeing a single SYN packet instead of 20. The bottom line is if you're using Typhoeus, the Keep-Alive header is redundant before you even set it.
What about compression? Typhoeus supports it but doesn't enable it by default. One nice out of the box feature though is that when compression is enabled, Typhoeus handles decompression of responses automatically. No need to hand-roll Zlib::GzipReader like with Net::HTTP. And it actually does help:
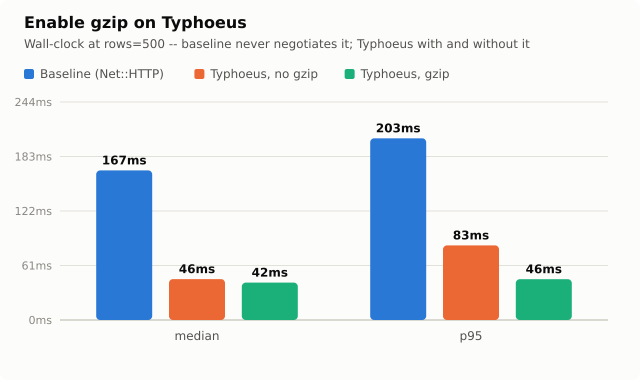
This is actually a much more interesting result, because once the redundant connection phases are eliminated, the effect of Gzip on transfer phase becomes more evident! Especially at the long tail, Typhoeus + gzip is extremely efficient.
That just leaves routing headers -- the one recommendation I hadn't revisited yet. The theory is sound: if writes and reads are both hitting the primary core, splitting reads off to a replica should relieve some of that contention. So I reran the same test, pointing reads at the replica:
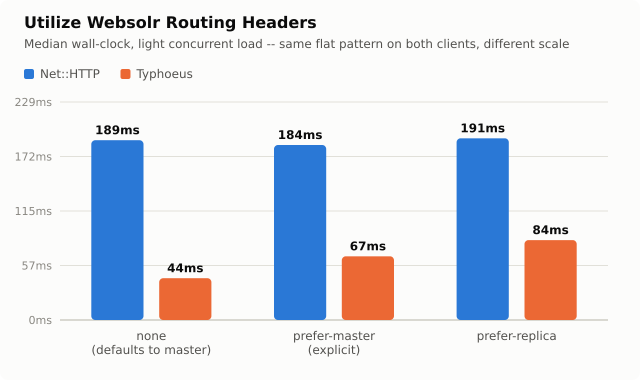
There's still a clear improvement relative to Net::HTTP, but I would have expected a similar consistency in latency, especially between the "none" and "prefer-master", since those are effectively the same thing.
Although to be fair, I am testing against Websolr's free-tier on a multitenant deployment. The higher latency on the replica core could be due to some noisy neighbor. And my benchmark doesn't really place significant contention on the primary core for a replica to relieve in the first place. The feature is built to solve a problem this test never creates. I'd want a lot more concurrent write pressure than a hobby-tier index can safely take before trusting a verdict.
In Search of Diminishing Returns🔗
I was wracking my brain for other things we could do to speed this up. Looking through the code, I realized that when Sunspot queries Solr, it's including a wt=json param.
I figured that must be adding overhead because Rails has to deserialize it into a Ruby hash anyway, so why not use Solr's built-in wt=ruby? I changed that thinking it would be an obvious win and did another benchmark test:
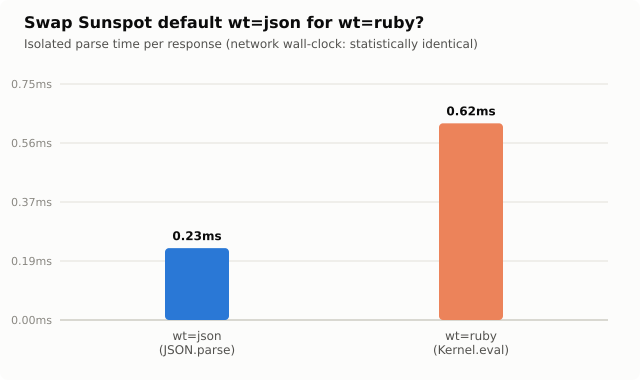
Turns out wt=ruby is slower on its own terms, never mind the network. It's almost 3x slower to turn a Ruby response into a Ruby object than to turn a JSON response into a Ruby hash.
Worse: in trying to understand why this happens, I found out that the Ruby object is evaluated with a raw Kernel.eval on whatever comes back in the response body. No sandboxing, no validation. Fuck that, don't use it.
I figured I'd looked at how Sunspot queries Solr, but not how it writes to Solr. The default is update_format=xml, so we're serializing our payloads into very verbose XML instead of something compact like JSON. To put some numbers to it, when I generated sample payloads, uncompressed JSON was ~42% smaller than the XML representation.
We're all about minimizing transfer phase, so fewer bytes is better, right? Benchmark says:
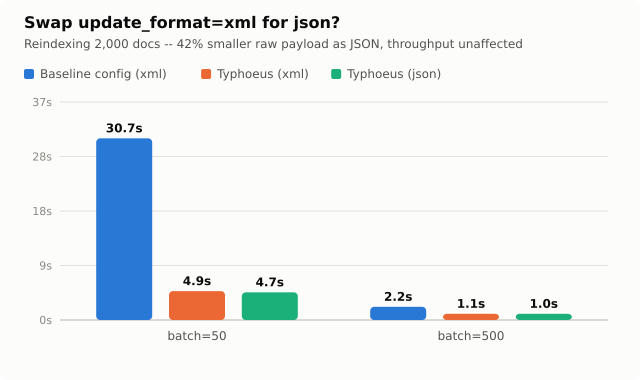
I mean, it's still considerably faster than the baseline, but we're not really getting much improvement. The thing is, we're using gzip over the wire, and when I compared the compressed generated payloads, the JSON was only 11% smaller than the XML. My best guess is that indexing cost here is dominated by Solr's own server-side work -- actually analyzing and committing the documents -- not by wire format. For documents this small, there's just not enough weight in the serialization step for the format to matter either way.
What Did We Learn Today?🔗
So with all of this in hand, we've landed on the two changes that make the biggest impact for basically all users:
- Swap out Net::HTTP for Typhoeus
- Enable gzip compression
JSON writes are worth doing too -- a smaller payload is never a bad idea, and it costs nothing to switch -- but the benchmark doesn't show it moving throughput. Don't expect it to carry any of the weight; the first two items are doing essentially all of the work.
With these changes in place, we see a massive reduction in overall latency:

We've finally proved out the underlying assumptions: Solr really is fast, and what New Relic reports really is mostly transit time rather than Solr doing work, connection reuse and compression really can speed up a slow request. QTime flat regardless of changes tested, exactly as expected.
So the next time someone tells me their Solr is slow, I can back up my platitudes with some raw numbers.
But first I'll probably ask which HTTP client they're using.
Appendix 1: Hail Hydra!🔗
Typhoeus::Hydra takes a different approach to concurrency: instead of handling requests one at a time, it hands a whole batch to libcurl's own multiplexer and runs them concurrently on a single thread, without spinning up a thread per request. On paper, that sounds like exactly the thing for a big batch of writes. I tested it:
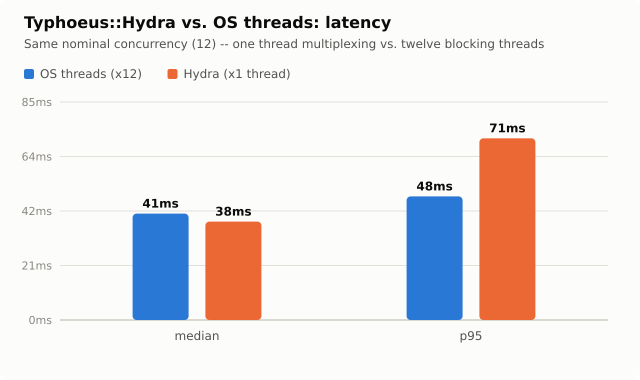
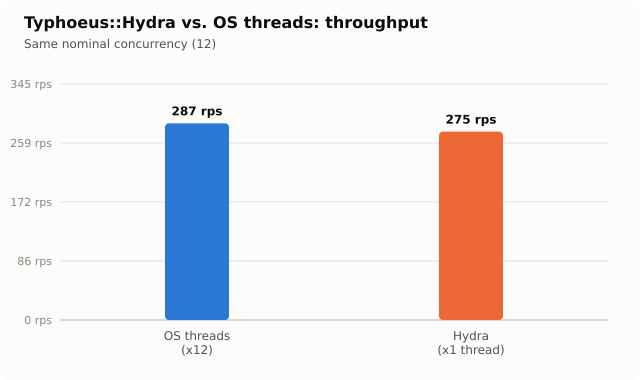
I don't think this means Hydra is bad. I think it means I couldn't generate enough load to see any advantage it has. A free-tier Websolr index doesn't have the concurrency ceiling to make "one thread juggling a hundred in-flight requests" meaningfully different from "a dozen OS threads each handling one." At real production scale, with hundreds of simultaneous writes, I'd expect Hydra to pull ahead. I just can't prove that here, and I'd rather say so plainly than round an inconclusive result up into a recommendation.
Appendix 2: Benchmarking🔗
Everyone has a different use case for Solr, and there isn't a general purpose benchmark suite that will cover all possible use cases. So I just decided to go with the bread and butter. I'd perform a series of basic tests:
- Reindex 50K docs
- Perform 1K searches
- Perform 1K mixed (read/write) ops
Solr reports a parameter called QTime, which essentially represents how much time it spent running a query (that's not exactly right, but it's correct-enough for our purposes). I'd measure both QTime and wall time like New Relic for each of these tests. I'd confirm that QTime is invariant while wall time goes up or down based on the changes made to Sunspot/Rails, and then work out which changes have the most impact.
Finally, because a majority of folks who report latency issues with Solr are running some kind of Rails app with the Sunspot gem, I decided to make Rails+Sunspot the framework for the benchmark test. Sunspot is a nice wrapper around the RSolr library, which does the actual legwork of interfacing with Solr.
To be clear, the question here is how much we can reduce latency between an application and a Solr server running on another machine. The context is reducing network latency when a network exists. It may seem obvious that if you're running Solr on the same machine that runs your application, the "network time" is in the nanosecond range -- however long it takes a signal to cross the silicon on your machine.
I mention this because I've lost an embarrasing amount of time explaining this to people who ask me some variation of: "when I benchmark Solr on my local machine in San Francisco, it responds in 1ms, but when I swap the target to my remote Solr instance in Virginia, it takes 500ms. please advise." Sadly there's no patch upgrade for the cosmic speed limit.
We're also not considering how to speed up queries here. By this, I mean the actual time Solr spends processing a query. That's a whole other article. This isn't a question of how to speed up a specific query through mapping or aggregations changes. It's a question of how to speed up any given query.