
I recently lost an afternoon trying to troubleshoot a problem with video drivers on my desktop running Arch Linux, which turned into an exercise in chasing all manner of bugs and gremlins. Partly my fault for switching from an integrated Intel GPU to a GTX 970 and assuming all would be fine. Derp. Everyone knows graphics drivers break Linux.
In any case, I was frustrated by the lack of insight I was able to get on what was happening inside the system. Arch has migrated over to systemd, which logs system events using journald. journald is kind of annoying because it stores log files in a binary format that can’t be read or grepped, which makes analysis and parsing a chore.
Arch does have support for syslog-ng, which is journald-aware and outputs plaintext files, but that still limits me to parsing through the logs via the command line. CLI tools like grep, awk, sed, tr (and more) are extremely fast and powerful, but aren’t particularly intelligent. Crafting a line that extracts everything I could possibly be interested in, in a form that conveys relationships, would take more time than simply reading a few 10K lines of event logs and gathering the intel myself.

Enter Logstash. Logstash is an awesome tool for log parsing. It’s the “L” in the powerful ELK stack, it is tightly integrated with Elasticsearch and Kibana, as well as the suite of tools that parent company Elastic maintains. Logstash can accept inputs from a number of different sources, apply a series of filters to the incoming data, then pass the results to a data store. In combination with Elasticsearch (for data storage, aggregation and retrieval) and Kibana (for analysis and visualization), you can get a very nice high-level view of a data set.
It occurred to me that while Logstash is, unfortunately, not journald-aware, I can use syslog-ng’s plaintext output as a Logstash input. syslog-ng is able to accept journald logs as input, apply filters, and output the stream to a plaintext file, which Logstash can monitor, parse and pass to Elasticsearch. With Kibana as a frontend, I can get a nice visual of system events over time, and I can use aggregations to figure out where and how problems are occurring.
The setup
The following instructions are specific to Arch Linux, but can be pretty easily adapted to most other systems. Here I use yaourt package manager as a shortcut, because it will install from both the official repos and the AUR (Elasticsearch is an official package, while Logstash and Kibana are user-maintained). The first step is to make sure syslog-ng and the ELK stack are installed:
yaourt -S elasticsearch kibana logstash syslog-ng
Once those packages are installed, we’ll need to do some configuration. First, edit the Kibana configuration file:
sudo nano /etc/elasticsearch/kibana/kibana.yml

# Make sure these settings are in place. All other defaults are fine:
server.port: 5601
server.host: "0.0.0.0"
elasticsearch.url: "http://localhost:9200"
Next, let’s make sure that syslog-ng is capturing all the journald outputs and passing them to a plaintext file. The default configuration for syslog-ng has a log called “everything.log,” but there is a slight catch. It logs everything except for authorization-type messages. Technically (to me, anyway), that’s not everything. For example, it won’t log failed SSH login attempts, so if someone is trying to brute force your system, it won’t appear in “everything.log” and won’t show up in Kibana. Let’s fix that:
sudo nano /etc/syslog-ng/syslog-ng.conf

# Find this line:
filter f_everything { level(debug..emerg) and not facility(auth, authpriv); };

# Change it to this:
filter f_everything { level(debug..emerg); };
Great, now we’re logging literally everything to “/var/log/everything.log”. Now let’s tell Logstash to use this file as an input:
sudo nano /etc/logstash/conf.d/elasticsearch.conf

# Make this the entire content of your conf file. We can expand on it later:

input {
  file {
    path => [ "/var/log/everything.log" ]
    type => "syslog"
  }
}
output {
  elasticsearch {
    hosts => ["localhost:9200"]
    index => "logstash"
  }
}
Finally, we’ll need to fiddle with some permissions to get Logstash to be able to actually read from this log file. By design, any file created by syslog-ng has a permission setting of 640 for root:log. If you look in /var/log for the everything.log file, you’ll probably see something like this:
$ ls -lAh /var/log/ | grep everything
-rw-r-----  1 root          log             5.3M Aug 18 12:39 everything.log
This basically says the file is owned by root and the group “log.” Root has r/w access to the file while users in the log group only have read access. We want Logstash to be able to read these files, so we’ll add the logstash user to the log group:
sudo usermod -G log logstash
A bit about what’s going on here: when Logstash is installed, a user and a group named logstash are created. Logstash runs as this user. This approach allows sysadmins to determine which log files specifically the process is able to access. Here, we’re giving Logstash read-only access to files created by syslog-ng, which is the minimum access necessary to do it’s job. Any file to which the logstash user is not specifically granted permission will be blocked. This is the safest way to allow a process access to potentially sensitive data.
Finally, we need to make sure that journald is configured so that syslog-ng can use it. This part is fairly simple:
sudo nano /etc/systemd/journald.conf

# Make sure these settings are uncommented:
Storage=auto
ForwardToSyslog=no
You’ll want to restart journald in order to ensure the changes took effect:
sudo systemctl restart systemd-journald.service
Starting up
Now that we have everything configured, we can start up the system. The first thing to do is make sure that syslog-ng is actually writing to /var/log/everything.log (otherwise, this whole exercise is kind of pointless). Open up a terminal window and run:
sudo tail -f /var/log/everything.log
Then in another terminal window, run:
# You don't actually need to run an upgrade...
sudo pacman -Syu
If syslog-ng is working, you should see something like this pop up under the tail command:
robs : TTY=pts/4 ; PWD=/home/robs ; USER=root ; COMMAND=/usr/bin/pacman -Syu
If nothing happens, you’ll need to check the configs and make sure it’s set up to write to the everything.log file. Also, it would be a good idea to verify that syslog-ng is actually running:
sudo systemctl --type=service | grep syslog-ng.service
If nothing shows up, you need to run:
sudo systemctl start syslog-ng.service
Give it a moment, then verify that it’s running using the previous command. If an error shows up, you can use sudo journalctl -fu syslog-ng to see what happened. I’ve never had a single problem with it, so I can’t offer much advice if you have problems here; try Google.
Next, you’ll want to start up the ELK stack. The stack members should all have .service files that allow them to be controlled with systemd. We need to do one more thing before the setup will work, and that is to create the “logstash” and “.kibana” indices in Elasticsearch. Go ahead and start up Elasticsearch using systemd:
sudo systemctl start elasticsearch
After a few seconds, you should be able to check that it’s up and running using curl:
# May need to run this a few times. It might take up to a minute before it starts
# returning the ES version number. If it seems to be taking far to long,
# check systemctl --type=service to see if elasticsearch.service errored or something

$ curl -s -XGET localhost:9200 | grep number
    "number" : "2.0.0"
Back when we initially created the Logstash configuration, we had a line that read index => "logstash". This tells Logstash to store everything in the “logstash” index in our Elasticsearch cluster. We need to do a little bit of work here, because A) in some cases, Elasticsearch won’t automatically create an index and will error if we try to send data to an index that doesn’t exist; and B) this is a single node system rather than a cluster, so we can’t use replication (Elasticsearch will shard/replicate indices by default). In sum, this means we need to create our indices manually to ensure they get the proper settings for our use case:
$ curl -s -XPUT 'http://localhost:9200/.kibana/' -d '{"settings":{"index":{"number_of_shards":1,"number_of_replicas":0}}}'

$ curl -s -XPUT 'http://localhost:9200/logstash/' -d '{"settings":{"index":{"number_of_shards":1,"number_of_replicas":0}}}'
These curl commands will create an index for Logstash and Kibana, using a single shard and no replicas. That ensures we’ll have a “green” cluster state, because Elasticsearch won’t be looking for other nodes to join the cluster. Once these indices are created, go ahead and verify the cluster state:
$ curl -s -XGET localhost:9200/_cluster/health?pretty
{
  "cluster_name" : "logstash",
  "status" : "green",
  ...
}
Next, we’ll spin up the rest of the ELK stack:
sudo systemctl start logstash kibana
Give them a moment to start up, then check that the system status is OK:
sudo systemctl --type=service | egrep '(elastic|logstash|kibana)'

elasticsearch.service   loaded active running Elasticsearch
kibana.service          loaded active running Kibana - dashboard for Elasticsearch
logstash.service        loaded active running Logstash Agent
If there are any errors, you may want to run sudo journald -fu <service> for the failed service, then use systemctl to restart it. That should show you what if anything is failing.
A few items to note: first, Logstash seems to take a while to start up, and when it does, it sends a ton of data along to the Elasticsearch cluster (anything that’s in the everything.log file that hasn’t already been indexed).
Running the system
Open up a browser and navigate to localhost:5601 to access the Kibana dashboard. When you first open it up, it will ask you for some configuration details. We’ve already created the “logstash” index, so when it asks for the “Index name or pattern,” you can simply use “logstash” (no wildcard).
Once that’s done, click on the Discover tab. You should (hopefully) be greeted with some data:
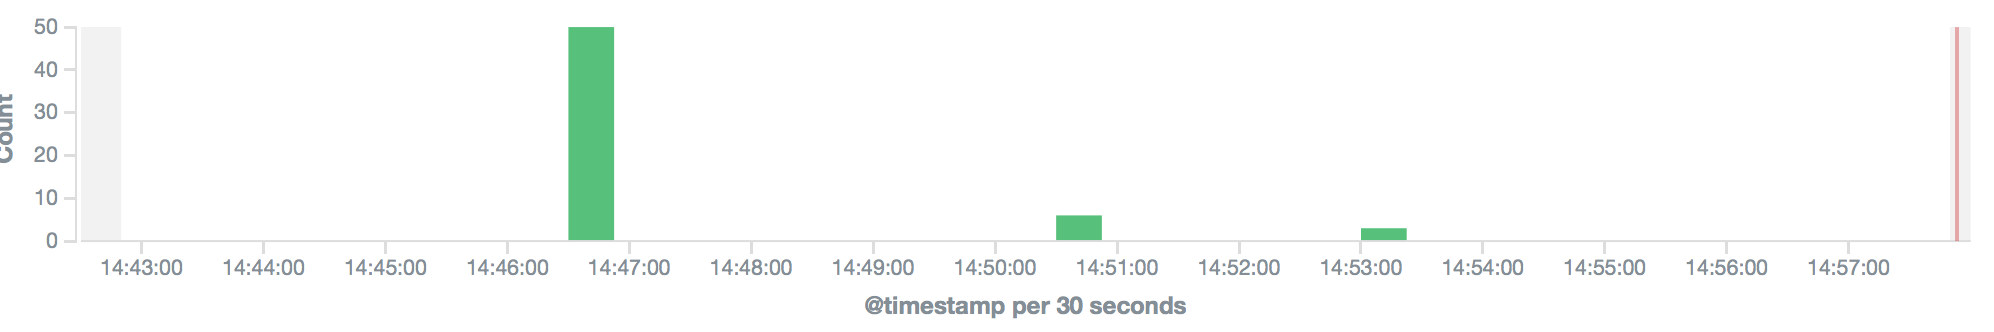
Depending on how much is happening on your system and how verbose your logging is configured, there may be a lot or a little bit of data to parse here. But it will fill out over time. The cool thing is that you can search for something like "sshd" and it will show any SSH connections that have been made and by which user. Or you can search for "sudo" and see who has been running sudo commands and what they’ve been attempting.
This post has already gone on a bit longer than I wanted, but it does merit a follow up soon. Elastic has an entire suite of tools available that integrate tightly with the ELK stack. Watcher for example allows you to configure alerts based on changes in the data. If you suddenly have a huge influx of failed login attempts or something, Watcher could notify you via email, Slack, PagerDuty, and more. In a future post, I’ll go into some of the cool things you can do with a setup like the one we’ve done here.